Friday, April 20, 2012

What the Chinese can tell Russia about assassinations and the Zioconned USA about its most Infamous White House Murder INC, in the Levant...


What the Chinese can tell Russia about assassinations and the Zioconned USA about its most Infamous White House Murder INC, in the Levant, ever since the odious political assassination in Lebanon of Mr. Elie HOBEIKA, January 24th 2002 on direct orders from Washington DC and its Sordid OSP....

By Steve LeVVines;

The White house Murder INC....


MP and Ex-Minister Mr. Elie Hobeika: He who sows to the Spirit, will from the Spirit reap eternal life... Our Lebanese heroes who gave their lives on the altars of the nation also taught us that he who has faith in the nation, in liberty, and in the rights of its citizens will defend them with absolute vigor and most honorable dedication, and will not fear any threats, threat of oppression, the loss of position or property, or the disappearance of "Thyself" in a Fiery Syro/Israeli Car BOMB, orchestrated by the most infamous White house Murder INC, with CIA's Blessing, logistics, utter disinformation for plausible deniability and more....The US/Israeli Ziocons are cowardly and despicable individuals who should be locked up for life for their barbaric war crimes and extra-judicial assassinations....in the Levant and Worldwide!

If China can detain the wife of a top politician on suspicion of murdering a British businessman, can there be hope that Russia will adjudicate the jailhouse death of Sergei Magnitsky? What about the elevator execution of journalist Anna Politkovskaya? Or the nuclear-isotope poisoning of former KGB officer Alexander Litvinenko?

Beijing has detained Gu Kailai, the wife of now-disgraced Communist Party official Bo Xilai, on suspicion of murdering Neil Heywood, a long-time British business associate whose body was found in a Chongqing hotel Nov. 15. At first, Chinese authorities blamed alcohol poisoning, but yesterday they said he was murdered.

The hard facts are clear, most experts agree -- this is a real murder, and authorities suspect that Gu and a servant played a role in it. But the rest is politics, said Chris Johnson, a former senior analyst on China for the CIA, and now a fellow at the Center for Strategic and International Studies. Johnson told me that Bo crossed an invisible line: He had seemed destined to be elevated to the all-powerful standing committee of the Communist Party Politburo. But he had created powerful enemies along the way, and ultimately self-destructed when a senior aide fled into a U.S. Consulate on Feb. 6, and divulged details of Bo's corrupt dealings, and the Heywood murder. Breaking the law and common decency are one thing when you are a senior Chinese official, but it appears that having it aired very publicly is quite another.

Yet even by those standards Russia falls short: Judging by the history of the last five or six years, if you commit a high-profile murder in Russia, you can be fairly assured of going on with your daily life unmolested.

There is no indication of a Bo copycat in Russia. Why? Newsweek's Owen Matthews puts it this way: Russia is one of the few countries where it's cool to be an outlaw.

One might wonder whether there is a corollary in the case of Mikhail Khodorkovsky, the billionaire oil baron who is languishing in prison after crossing Prime Minister Vladimir Putin. It isn't. Bo is a political enemy of some powerful Communist Party officials, but not sufficient numbers to have prevented his elevation. Khodorkovsky fatally crossed the line simply by acting threateningly on a presumption that he could be a major political force.

Consider the Magnitsky case. To date, senior Interior Ministry officials implicated in his death have appeared to become rich, but have not been subject to any visible prosecutorial attention. This week, Russian prosecutors said they had closed a case against Larisa Litvinova, a doctor in the prison where Magnitsky died.

In November 2009, the 37-year-old Magnitsky -- a lawyer for American investor Bill Browder -- died in a Moscow prison after 11 months in detention on charges that he robbed the state of $230 million. The charges were brought by Interior Ministry officials whom Magnitsky had first accused of stealing the same money. Evidence collected by Browder appears to show that Magnitsky's death was a result of deliberate neglect of hepatitis and heart disease developed while he was in prison.

The case has resulted in a serious cloud over Russia, and the Kremlin. The U.S. has barred dozens of Russian officials from visiting the United States. In a statement, State Department spokesman Victoria Nuland said, "The investigation into the circumstances of Magnitsky's death has been inadequate and has failed to produce justice."

The Politkovskaya case follows a familiar pattern: Politkovskaya, who received numerous international awards for investigative journalism, was murdered in her apartment elevator in November 2006. Amid much local and foreign pressure, Russian authorities implicated gang members and police colonel. However, the defendants have gone free and vanished after acquittals, and authorities either never found, or simply did not publicly name, the mastermind.

Litvinenko, who had fled to the United Kingdom after revealing the existence of a KGB hit-squad-for-pay, died in December 2006 from the effects of ingesting Polonium-210, a nuclear isotope that had been dropped into his tea at a London hotel restaurant. U.K. authorities implicated Andrei Lugovoi, a former KGB acquaintance of Litvinenko's, and requested his extradition. Russia refused, and Lugovoi (pictured above right, next to Dmitry Kovtun, who was also implicated in the case) won a seat in the Duma.

Russian authorities have variously blamed exiled billionaire Boris Berezovsky for the murder, and suggested that Litvinenko poisoned himself....

Friday, April 13, 2012

The Saudis/Wahhabi filth have been ordering tankers by the bushel of late....


The Saudis/Wahhabi filth have been ordering tankers by the bushel of late....in the dire hope of an attack on Shia Iran.....

http://247wallst.com/2012/03/20/saudis-ready-fleet-of-tankers-to-send-to-the-us/

For the past week, the day rates for very-large crude carriers (VLCCs) has been rising to where $40,000/day is the going rate. The reason for the spike is that the Kingdom of Saudi Arabia has hired 11 of the 2 million-barrel-capacity VLCCs and has begun filling the

The Financial Times nails the reason:tankers with crude. Destination: USA.

The hiring spree was the most public move by the kingdom in a series of efforts aimed at bringing down oil prices from $125 a barrel towards $100.

The Saudis do not want crude priced at $125/barrel. Besides the massive tanker shipment, they are believed to be shipping crude to foreign storage terminals, as they did last year and they are bringing back on-line fields that have been shut-in, and planning to re-start a pipeline that would allow them to ship at least some of their crude in the event Iran closes the Strait of Hormuz.

The 22 million barrels that are being sent to the US are nearly equal to the 30 million barrels the US released last year from its Strategic Petroleum Reserve when the turmoil in Libya essentially stopped crude shipments from that country. The effect was to lower prices sharply, although they did rise again fairly quickly.

The Saudis are seeking to prove that they have the ability to replace any lost crude shipments from any country in OPEC. If they can do that, they retain their de facto leadership of the group. If they cannot, then Iran threatens to take over the cartel.

The tanker fleet has almost nothing to do with helping the US and everything to do with maintaining the Saudis’ position as the big dog in the Middle East. One side effect, of course, is that the President can take credit for lowering crude prices when, in fact, all he did was wake up in the morning. As for helping President Obama’s re-election hopes, this is way too early to have much impact — unless the Saudis can keep shipping extra millions of barrels until November.

Paul Ausick

http://www.theoildrum.com/node/9106#more

The US Energy Information Administration (EIA) recently released full-year 2011 world oil production data. In this post, I would like show some graphs of recent data, and provide some views as to where this leads with respect to future production.

World oil supply is not growing very much


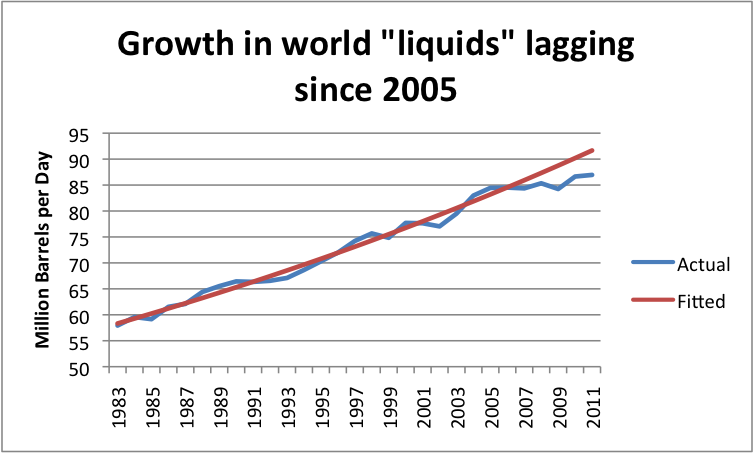
Figure 1. World crude oil and other "liquids" supply has dropped below the 1983-2005 trend line in recent years. Actual data is from EIA International Petroleum Monthly, through December 2011.

The fitted line in Figure 1 suggests a “normal” growth in oil supplies (including substitutes) of 1.6% a year, based on the 1983 to 2005 pattern, or total growth of 10.2% between 2005 and 20011. Instead of 10.2%, actual growth between 2005 and 2010 amounted to only 3.0% including crude oil and substitutes.

The shortfall in oil production relative to what would have been expected based on the 1983-2005 growth pattern amounted to 4.7 million barrels in 2011. This is far more than any country claims as spare capacity. This is no doubt one of the reasons why oil prices are as high they are now. These high oil prices tend to interfere with economic growth of oil importing nations.

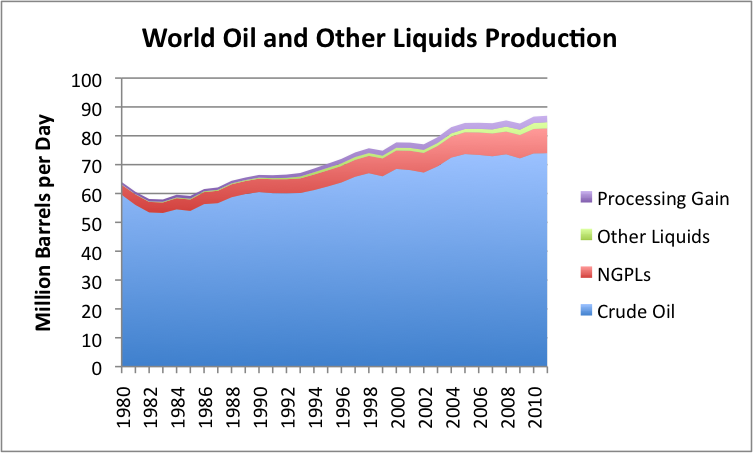
The shortfall in growth especially occurred in crude oil. Figure 2, below, shows crude oil production separately from substitutes.


Figure 2. World oil and other liquids supply, broken out into crude and condensate, natural gas plant liquids, other liquids (mostly ethanol), and processing gain (increase in volume from refining heavy oil), based on EIA data.

Between 2005 and 2011, crude oil production rose only 0.5%. It was mostly the substitutes that grew.

Top Oil Producers

The top five crude oil producers in 2011, based on the new data are

  1. Russia – 9.8 million barrels a day (mbd)
  2. Saudi Arabia – 9.5 mbd
  3. United States – 5.7 mbd
  4. China – 4.1 mbd
  5. Iran – 4.1 mbd

The top five producers when substitute liquids of various kinds are included are the same countries, but in a different order. On this basis, the US also appears to be closer to catching up to the top two.

  1. Saudi Arabia – 11.2 mbd
  2. Russia – 10.2 mbd
  3. United States – 10.1 mbd
  4. China – 4.3 mbd
  5. Iran – 4.2 mbd

While substitute liquids are OK, they are not really crude oil. Natural gas liquids are the largest category. In the US, they sell for a little less than half as much as crude oil, based on the composition and costs shown in this post. On an energy content basis, they provide about 70% as much energy per barrel as crude oil.

“Other liquids” has also been growing. It is mostly ethanol, which has about 60% of the energy content of crude oil per barrel. This category also includes biodiesel, liquid fuels made from coal or from natural gas, and even a mixture of water with very heavy oil called “Orinoco emulsion“.

There is also growth in “processing gain”. This term refers to the extra volume that is gained when long hydrocarbons of heavy oil are”cracked” into shorter molecules. The EIA assigns this growth back to the country doing the refining. The US comes out ahead in this comparison because it imports a lot of heavy oil, and uses its complex refineries to crack it into shorter chains, such as diesel fuel and gasoline. If the heavy oil imports were to go to another country with complex refineries (such as China), the processing gain would go with it.

Looking at the Top Five Oil Producers

Of the top five oil producers, only the US and China have been growing very rapidly, and China’s growth now seems to be hitting limits. Let’s look at the five largest countries individually.

Russian Oil Production

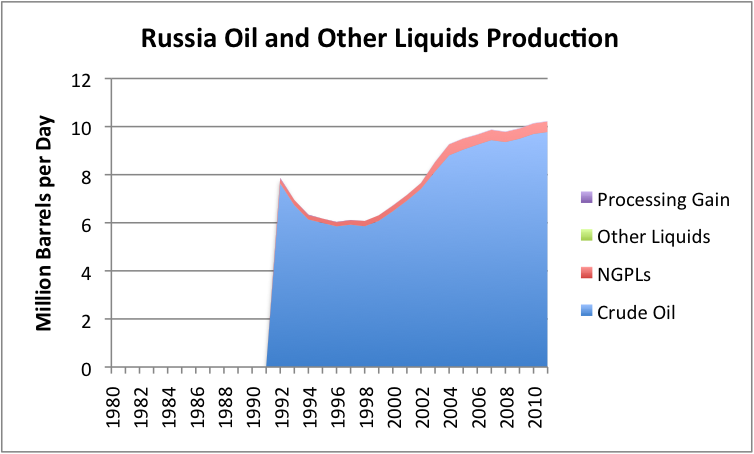
Between 2005 and 2011, Russia’s oil production (including substitutes) grew by 7.5%. This is better than the world average of 3.0%, but still falls short of the expected growth between 2005 and 2011 of 10.2%, mentioned above, based on the 1983 to 2005 world growth pattern.


Figure 3. Russia oil and other liquids production based on EIA data.

In 2011, Russia’s crude oil production grew by 0.6%. Growth may be slowing even further in the future. Russian Economic Minister, Elvira Nabiullina, was recently quoted as saying that Russia’s possibilities for crude oil growth have been exhausted and that Russia’s oil output will stabilize at the 2011 level for the next 20 years.

Saudi Arabian Oil Production

Figure 4 (below) shows that Saudi Arabia’s oil production has not increased much on an annual basis since 2005.


Figure 4. Saudi Arabia oil and other liquids production, based on EIA data.

Looking at crude oil only, Saudi Arabia’s production is down by 0.8% since 2005. If one includes natural gas plant liquids (mostly ethane, propane, and butane), Saudi Arabia’s oil production for the year 2011 is up by 0.6% since 2005. This is less than the world average of 3.0%.

Saudi Arabia’s oil production bounces around. Admittedly, for some individual months, Saudi Arabia has broken its own record for crude oil production, but there is no pattern of continuously increasing production, such as is needed to increase world oil supply.

United States Oil Production

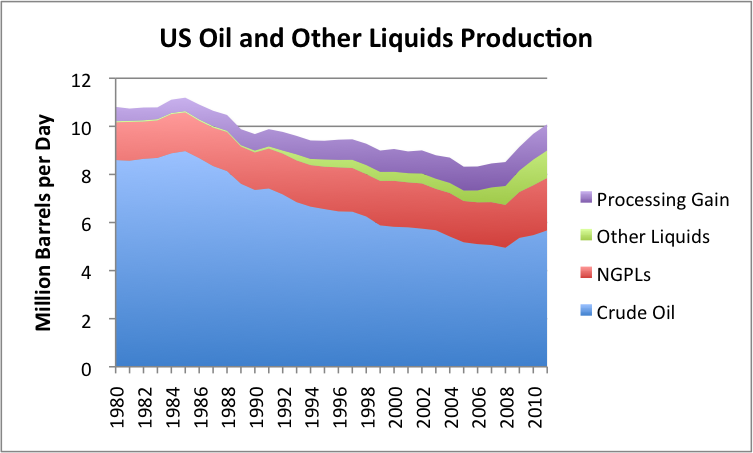
US oil production is growing (total liquids supply increased by 21.2% between 2005 and 2011), but the major portion of the growth is coming from oil substitutes.


Figure 5. US oil and other liquids production, based on EIA data.

A comparison of the thickness of non-blue bands on the US graph with those of the world (Figure 2) and with other countries shows how disproportionate the US mixture is.

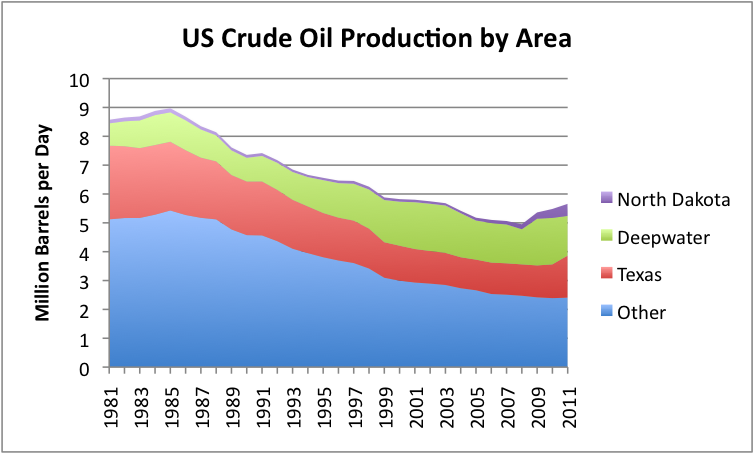
If we look at US crude oil production by area of the country, we see that while Bakken production in North Dakota has been growing, it is still a small proportion of US total production.


Figure 6. US crude oil production by area, based on EIA data.

Before the shale oil rush, the biggest growth in US oil production had been from what I have called “deepwater”(what is called “Federal Offshore” in the EIA data). This production is down by over 200,000 barrels a day in 2011, more than double the growth in North Dakota production.

The other recent area of oil production growth is Texas. While EIA data does not break the production out by field, higher production from the Eagle Ford shale and the Permian Basin are likely major contributors.

China’s Oil Production

China’s oil production plateaued in 2011, after many years of strong growth.


Figure 7. China oil and other liquids production, based on EIA data.

Figure 7 shows that China’s oil production for 2011 slightly decreased. The Financial Times recently reported that part of the problem is an outage of over 150,000 barrels a day in the Penglai 19-3 field, which reduced production starting in September 2011, but is now coming back on line. But even apart from this, China is reported to be struggling to find new production to offset declines in aging fields. The Financial Times calls the outlook “challenging”.

If China’s oil production fails to grow in the future, or declines, it means that China will need to import even more oil than it has in the recent past. This will put even more pressure on world oil supply.

Iran’s Oil Production

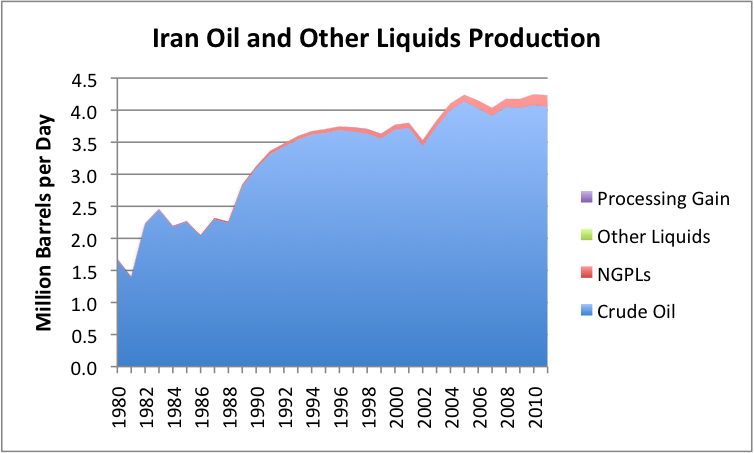
Iran is constantly in the news with discussions of more sanctions and the possibility of cutting off Iran’s oil exports. While it is listed above as fifth in world oil production, it is almost tied with China for fourth in world oil production.


Figure 8. Iran oil and other liquids production, based on EIA data.

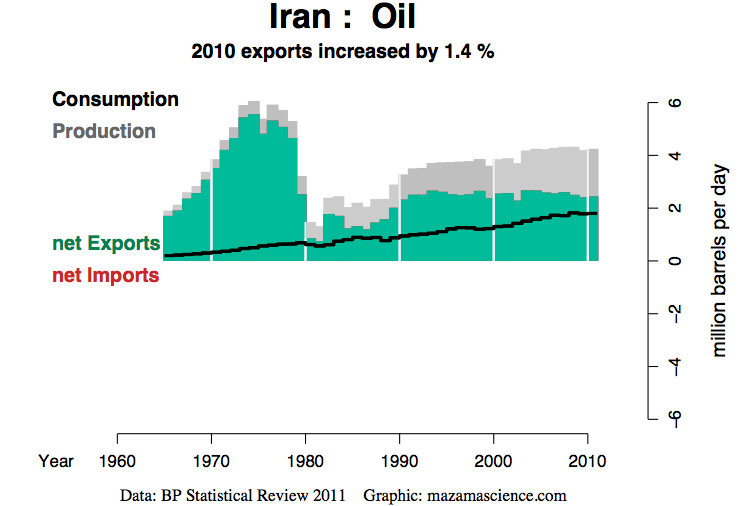
Iran’s oil production hit a high point in 2005, and is down slightly from that level. Its exports are down even more:


Figure 9. Crude oil and natural gas liquids production (gray), consumption (black line) and exports (green). Data is from BP, and only through 2010. Graph from Energy Export Data Browser.

The fact that Iran’s oil production is not growing is no doubt one of the reasons it is interested in electricity production from nuclear energy.

In my view, Iran’s oil exports of over 2 million barrels a day are very much needed to maintain reasonable stability in world oil prices. We would be better off finding a different way to settle our differences with Iran than cutting off exports.

Other Areas of Interest

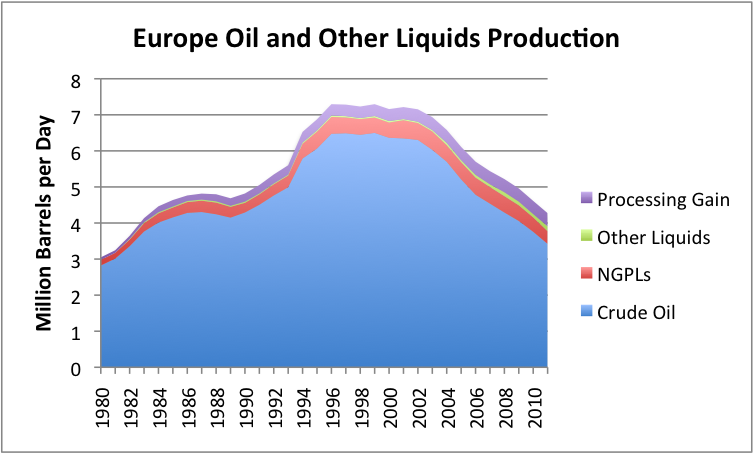
The North Sea has been a problem area, with declining production. EIA data does not show this grouping separate. Instead it shows data for Europe in total.

Europe has surprisingly low oil production. On a crude oil basis, Europe’s 2011 production is below that of Iran (3.4 mbd for Europe, and 4.1 mbd for Iran). With the various substitutes included, Europe’s production is approximately equal to that of China – 4.3 mbd, and slightly ahead of Iran’s at 4.2 mbd.


Figure 10. Europe oil and other liquids production, based on EIA data.

Clearly Europe has a very serious problem with falling oil production. In 2011 alone, crude oil production was down by 8.9%, and more broadly defined liquids were down by 7.4%. Europe’s declining oil production is no doubt contributing to it financial problems.

In contrast to Europe, there are a number of bright spots with respect to world oil supply.

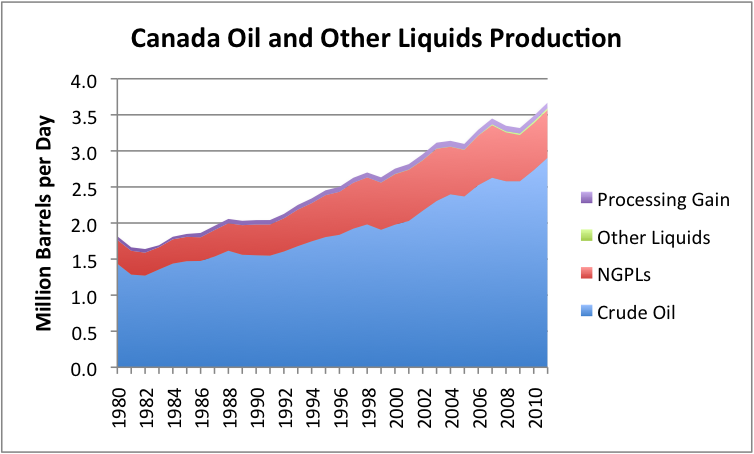
Canada’s oil supply is increasing:


Figure 11. Canada oil and other liquids supply, based on EIA data.

Of course, one of the issues relating to Canada is that quite a bit of the increase is from the oil sands. This production is of concern for environmental reasons.

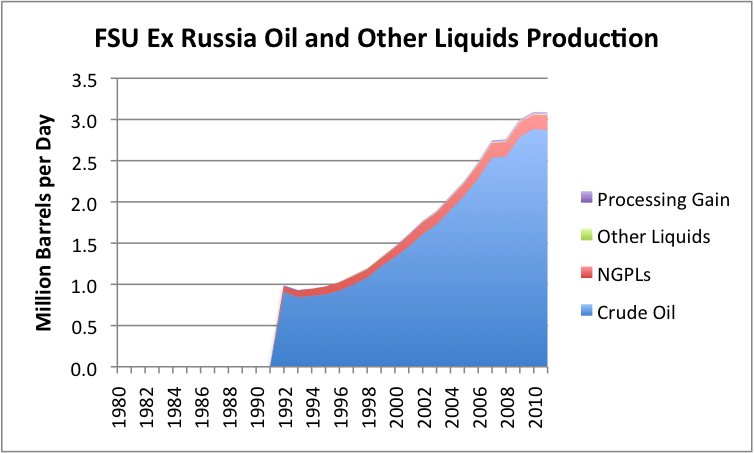
The Former Soviet Union excluding Russia is another area where production has been increasing, at least until recently.


Figure 12. Former Soviet Union (FSU) excluding oil and other liquids supply, based on EIA data.

The graph would seem to suggest that production may have plateaued in this area, as well.

Qatar is a small country, but is showing rapidly increasing production from a small base:


Figure 13. Qatar oil and other liquids production, based on EIA data.

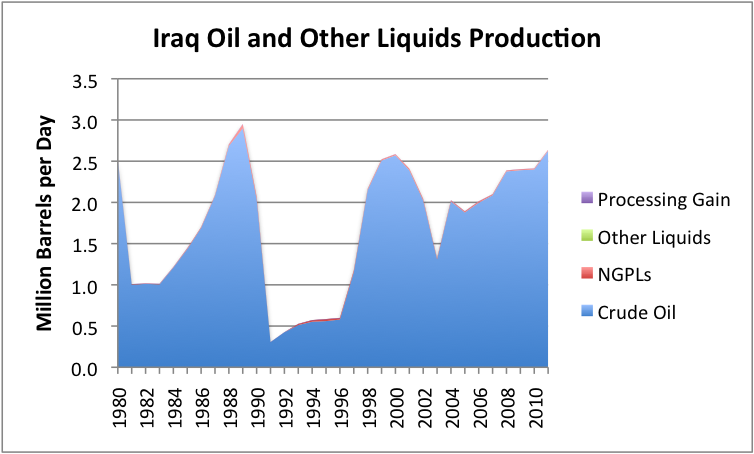
Iraq is often mentioned as an area which may have increased production in the future.


Figure 14. Iraq oil and other liquids production based on EIA data.

Figure 14 shows that there really hasn’t been a huge increase in production so far. Past history is so unstable that it raises questions about Iraq’s ability to ramp up production in the future.

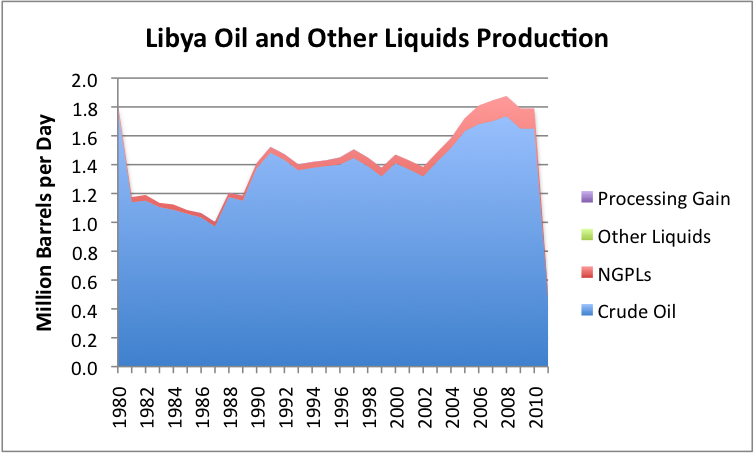
Libya is mentioned as having a possibility of increasing production, at least relative to the drop off in 2011.


Figure 15. Libya oil and other liquids production, based on EIA data.

While some increase from the 800,000 barrels a day production EIA reported for December seems likely, it may never fully get back to its old level. A recent analysis says Oil Production Still Unstable in Libya. According to this article, security concerns are likely to hold back future investment by outside companies in Libyan production, and sluggish political decision-making is likely to hold back actions of Libya’s National Oil Company.

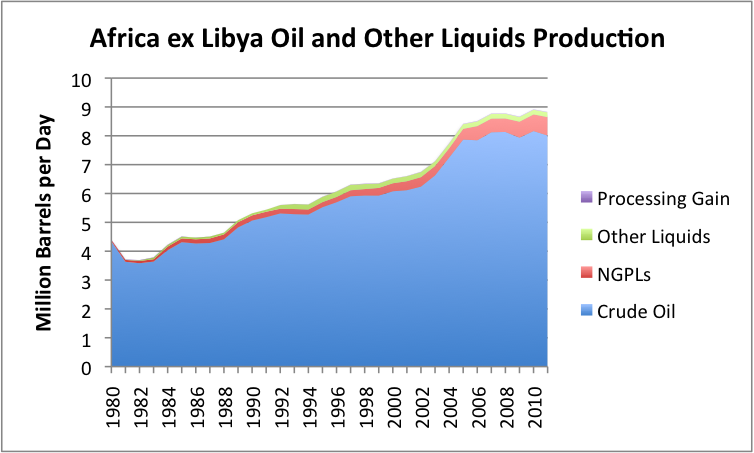
Various African countries are mentioned from time to time as providing new sources of production. But when we look at African production, excluding that of Libya, we see that at least so far, African production, excluding Libya, is on a plateau.


Figure 16. Africa excluding Libya oil and other liquids production, based on EIA data.

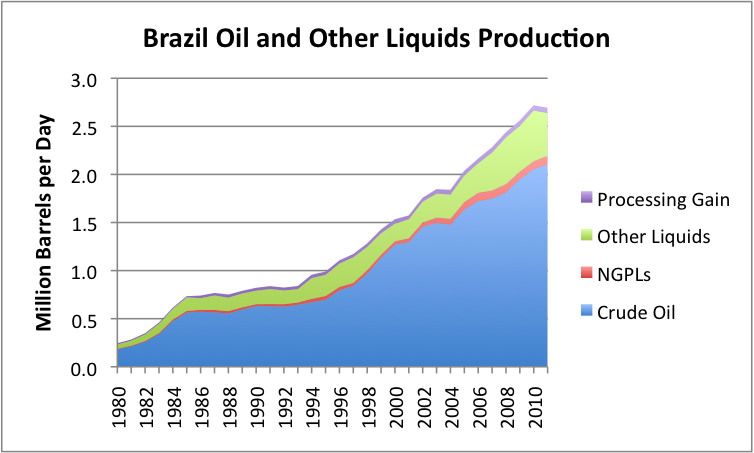
Brazil is also mentioned as a growth opportunity.


Figure 17. Brazil oil and other liquids production, based on EIA data.

The actual increases to date have been small, however. Crude oil production in 2011 increased by only about 51,000 barrels a day over 2010. Ethanol production decreased, so that total liquids production decreased slightly in 2011.

Conclusions

It is easy to find small opportunities where it looks possible to increase oil production, but on a world-wide basis, it appears likely that at best, very slow growth will continue. The oil production of China and Russia were previously increasing, but now seem to be hitting plateaus. Even smaller groupings, such as the FSU excluding Russia, seem to be hitting plateaus.

Future prospects for oil supply look to be worse, especially if Iranian exports are taken off line, or if there are unexpected surprises on the downside. One concern is that political disruptions may take oil production offline in additional countries. Anther is that financial disruptions (perhaps related to European debt defaults) may lead to lower oil prices, cutting off some marginal supply.

On balance, it would appear that at best, oil production in the near future will be virtually flat, leading to more spiking of oil prices and greater world economic problems. Another possibility is that world production will begin to decline. The likelihood of decline would appear to be increased if more oil exporters encounter political disruptions, or if the world enters a major recession leading to an oil price decline.

This post originally appeared on Our Finite World.

Be aware that this is production only (analyzes the top 5 in 2011 Russia. Saudi Arabia, US China, Iran. with regional reports on other areas] without reference of NET EXPORTS, which considers the internal use of hydrocarbons by producing nations, leaving what is left for export - of the top 5 only 3 have export -two are importers, USA and China....